Excellent developer experience is one of the most important focus areas for Cloud Spanner, Google’s fully managed horizontally scalable relational database service. Whether you are a database specialist or a developer, it is important to have tools that help you understand the performance of your database, detect if something goes wrong, and fix the problems. So, Spanner has been continuously adding new introspection capabilities that allow you to easily monitor database performance, diagnose and fix potential issues, and optimize the overall efficiency of your application.
We’ve recently launched a number of introspection tools in the form of built-in tables that you can query to gain helpful insights about operations in Spanner such as queries, reads, and transactions. These new introspection tables, when combined with existing alerting and monitoring capabilities, provide a powerful combination of tools that help you to diagnose and troubleshoot issues. Let’s take a closer look at these new introspection tools. We will start with the basics on how you can leverage the introspection and monitoring capabilities in Spanner to get the best out of your data-driven applications.
How do you monitor resource utilization?
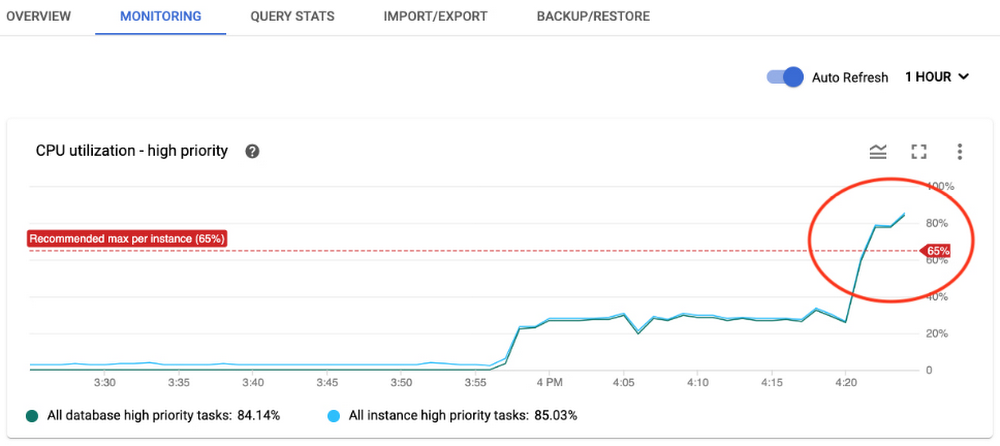
CPU and storage are key resources that you need to monitor in Spanner to make sure that your instance is provisioned with enough nodes to give you the expected performance. Spanner already has integration with the Google Cloud Monitoring suite, where you can set alerts for CPU and storage utilization metrics based on recommended thresholds. You will be automatically alerted when the value of the metrics cross the threshold. You can visit the monitoring tab in the Spanner console to look at the metrics in detail and analyze how those change over time.
Here’s an example: Let’s say you received an alert for CPU utilization and found a spike in the monitoring graph, as shown below.
You can further slice and dice the data by visiting the Cloud Monitoring console and selecting the time periods. You can also filter by options such as instance, database, and priority of operations for detailed analysis and to decide where to focus for further investigation. You can even correlate different metrics from the metrics list to identify reasons for the spike and decide on possible remedies. For example, if an increase in API requests correlates with an increase in CPU utilization, you can infer that the workload on Spanner is causing an increase in CPU utilization and you need to provision more nodes to bring CPU utilization back within recommended limits.
If CPU utilization has spiked without an increase in requests, then inefficient SQL queries or reads could be consuming higher CPU. How do you know which SQL queries or reads you should investigate? We have built introspection tables to help you with that. Visit the “New Introspection Tools” section in this blog, below, or the documentation to learn more.
How do you monitor performance?
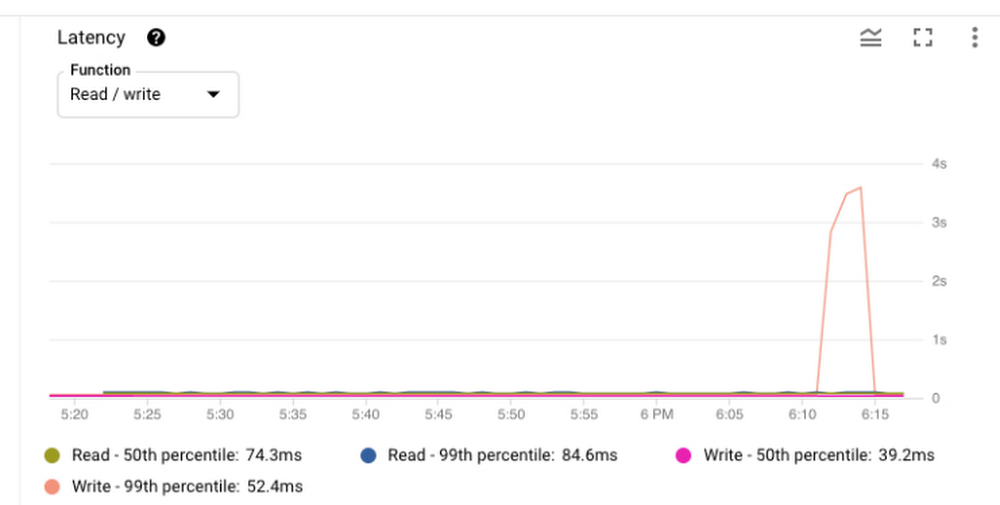
You may have specific performance requirements for your application such as throughput expectation or latency expectation. For example, let’s say you want the 99th percentile latency for write operations to be less than 60ms, and have configured alerts if the latency metric raises above that threshold.
Once you are alerted that write latency has exceeded the threshold, you can investigate this incident via the Spanner console by reviewing the latency graph. For example, in the image above, you can see that 99th percentile latency for write operations had spiked at around 6:10AM. Using the Cloud Monitoring console, you can determine which API methods contributed to latency spikes. Let’s say you find out that Commit APIs were responsible for the latency spike. As a next step, you want to know which transactions involve expensive commits. What were the reasons for increase in commit latency?
To help you with that troubleshooting, we have built new introspection tools that provide detailed information and statistics regarding top queries, reads, transactions, and transaction locks. These tools consist of a set of built-in tables that you can query to gain more insight. Refer to this table to decide when to use each tool. Now, let’s take a closer look at what each tool offers.
Exploring new Spanner introspection tools
Diving deep into SQL queries
Query statistics: When you want to identify and investigate the expensive queries and their performance impact, use theQuery statistics table. This table helps you answer questions such as:
-
Which are the most CPU-consuming queries?
-
What is the average latency per query?
-
What were the number of rows scanned and data bytes returned by the query?
Here is an example of the result from the table, where you can easily identify the fingerprint of the top two queries that consumed the most CPU and had highest latency.
Use these fingerprints to retrieve actual query texts from the table. As a next step, you can use the query explanation feature in the Spanner console to analyze query execution plans and optimize the queries. Spanner recently enhanced query statistics further by adding additional insights to cancelled/failed queries so that customers can troubleshoot different kinds of queries, not just completed queries.
Oldest active queries: While the query statistics table helps you analyze past queries, oldest active queries table helps you identify the queries that are causing latency and high CPU usage issues as they are happening. This table helps you answer questions such as:
-
How many queries are running at the moment?
-
Which are the long-running queries?
-
Which session is running the query?
These answers will help you to identify the troublesome queries and resolve the issue quickly rather than boiling the ocean. For example: Once you identify the slowest query that is impacting the application performance, you can take steps such as deleting the session for an immediate resolution.
Diving deep into read operations
Read statistics: When you want to troubleshoot issues caused by read traffic, use the Read statistics table. This table helps you answer questions such as:
-
Which are the most CPU-consuming read operations?
-
What is the average CPU consumption per read?
-
What was the amount of different wait times associated with these reads?
As a next step, you can optimize these read operations or take a decision on the suitable read operation (strong vs. stale reads) for your use case.
Diving deep into read-write transactions
Transaction statistics: When you want to troubleshoot issues caused by transactions, use the Transaction statistics table to get greater visibility into factors that are driving the performance of your read-write transactions. This table helps you answer questions such as:
-
Which are the slow-running transactions?
-
What is the commit latency and overall latency for transactions?
-
How many times did the transaction attempt to commit?
-
Which columns were written or read by the transaction?
By analyzing this information, you can discover potential bottlenecks such as large volumes of updates to a particular column slowing down the transaction. One of the frequent causes of transaction performance issues is lock conflict. If you see an increase in commit latency or overall latency for any transaction, use the lock statistics table to identify if transaction locks are causing issues.
Lock statistics: Once you identify the transactions that are affecting the performance, use the lock statistics table to correlate transaction performance characteristics with lock conflicts. This table helps you answer questions such as:
-
Which rows and columns are the sources of higher lock conflicts?
-
Which kinds of lock conflicts are occurring?
-
What is the wait time due to lock conflict?
When you combine these crucial insights regarding sources of lock conflicts in the database with the transaction statistics table, you can identify the troublesome transactions. As a next step, apply the recommended best practices to optimize the transactions and improve the performance.
Client-side metrics and Google Front End metrics monitoring
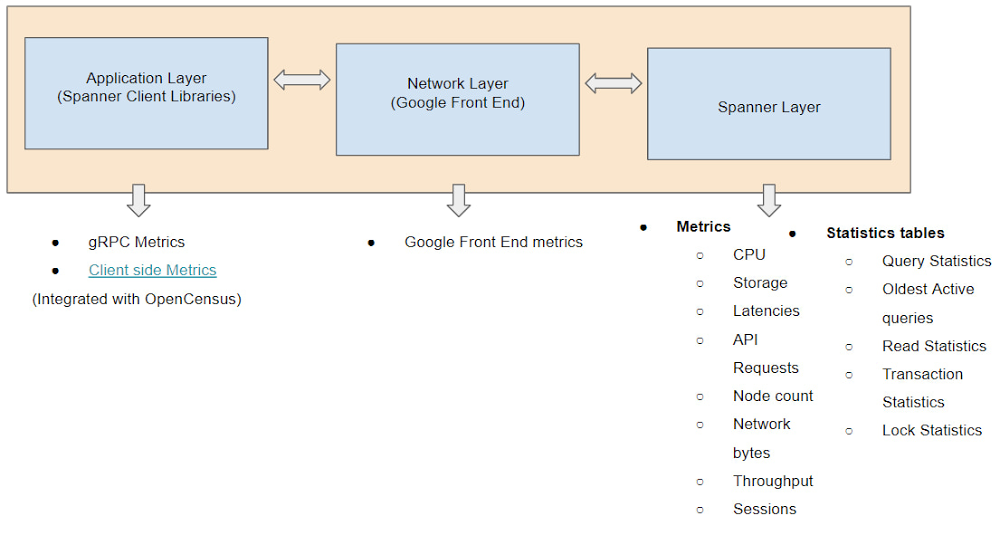
So far, we discussed how to use introspection metrics and tools at the Spanner layer. But for end-to-end monitoring, it is important to monitor the application layer (client side) and the network layer (Google Front End) too since sometimes the issues could be in those layers. Spanner already has integration with OpenCensus to help you monitor client-side metrics and gRPC metrics. Spanner also provides Google Front End-related metrics to help you determine if latency issues are due to the network layer. When you combine client-side metrics and Google Front End metrics with Spanner layer metrics, you can perform end-to-end monitoring and find out the source of the issue to proceed with further troubleshooting.
We hope these updates to Spanner introspection capabilities make developing on Spanner even more productive.Check out our Spanner YouTube playlist for more about Spanner.
Learn more
-
To get started with Spanner, create an instanceor try it out with a Spanner Qwiklab.
-
Read the following blogs to learn more about how you can use the introspection tools for troubleshooting:


