Developers & Practitioners
This blog post focuses on how Vertex AI enables one of the core aspects of MLOps: monitoring models deployed in production for training-serving skew.
Vertex AI, a managed platform that allows companies to accelerate the deployment and maintenance of artificial intelligence (AI) models.
Here we will describe how Vertex AI makes it easy to:
-
Turn on skew detection for a model deployed in Vertex AI’s Online Prediction service. No prior pre-processing tasks are required. Just run a command with a few basic parameters to turn on monitoring.
-
Get alerted when data skew is detected.
-
Visualize the skew in a console UI to quickly diagnose the issue and determine the appropriate corrective action.
What is training-serving skew and how does it impact models deployed in production
Here is a definition of training-serving skew (from Rules of Machine Learning: Best Practices for ML Engineering):
Training-serving skew is a difference between model performance during training and performance during serving. This skew can be caused by:
-
A discrepancy between how you handle data in the training and serving pipelines.
-
A change in the data between when you train and when you serve.
-
A feedback loop between your model and your algorithm.
In this blog post we will focus on tooling to help you identify the issues described by the first two bullets above: any change in the data (feature values) between training and serving, also known as data drift or covariate shift. The feedback loop problem mentioned in the third bullet point has to be addressed by proper ML system design. Please refer to this blog post for a description of how the Vertex Feature Store can help avoid this feedback loop problem.
Changes in the input data can occur for multiple reasons: a bug inadvertently introduced to the production data pipeline, a fundamental change in the concept the model is trained to predict, a malicious attack on your service, and so on.
Let’s look at a few real-world examples that impacted Google applications in the past. This paper — Data Validation for Machine Learning — describes the following incident:
-
A ML pipeline trains a new ML model every day
-
An engineer does some refactoring of the serving stack, inadvertently introducing a bug that pins a specific feature to -1
-
Because the ML model is robust to data changes, it doesn’t output any error and continues to generate predictions, albeit with lower accuracy
-
The serving data is reused for training the next model. Hence the problem persists and gets worse until it is discovered.
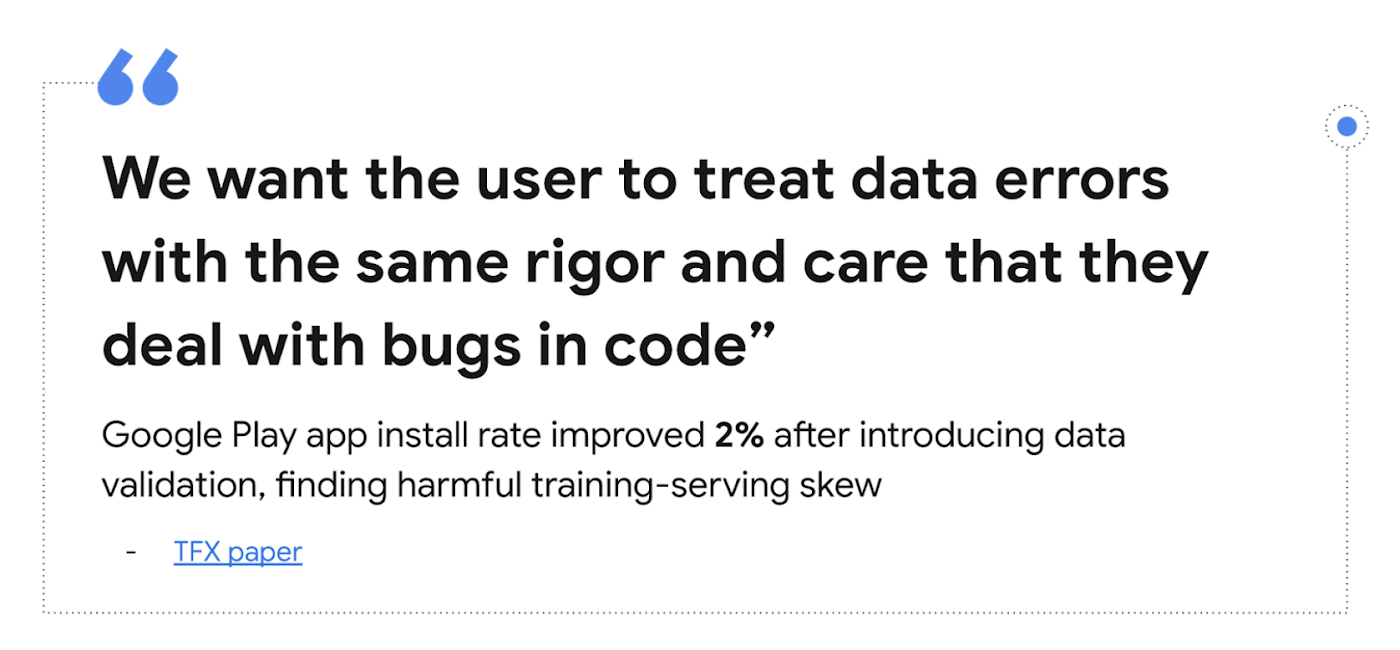
As this scenario illustrates, training-serving skew can sometimes be as harmful as a P0 bug in your program code. To detect such issues faster, Google introduced a rigorous practice of training-serving data skew detection for all production ML applications. As stated in this TFX paper:

Let’s look at how this practice helped Google Play improve app install rate:
By comparing the statistics of serving logs and training data on the same day, Google Play discovered a few features that were always missing from the logs, but always present in training. The results of an online A/B experiment showed that removing this skew improved the app install rate on the main landing page of the app store by 2%.
(from TFX: A TensorFlow-Based Production-Scale Machine Learning Platform)
Thus, one of the most important MLOps lessons Google has learned is: continuously monitor model input data for changes. For a production ML application, this is just as important as writing unit tests.
Let’s take a look at how skew detection works in Vertex AI.
How is skew identified
Vertex AI enables skew detection for numerical and categorical features. For each feature that is monitored, first the statistical distribution of the feature’s values in the training data is computed. Let’s call this the “baseline” distribution.
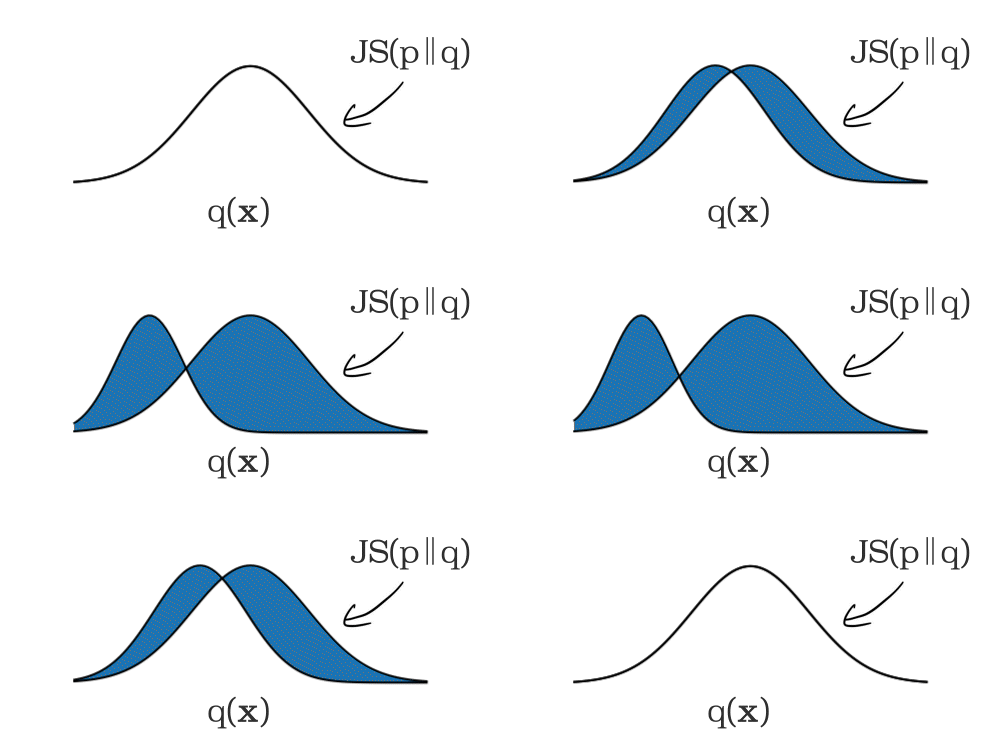
The production (i.e. serving) feature inputs are logged and analyzed at a user determined time interval. This time interval is set to 24 hours by default, and can be set to any value greater than 1 hour. For each time window, the statistical distributions of each monitored feature’s values are computed and compared against the aforementioned training baseline. A statistical distance score is computed between the serving feature distribution and training baseline distribution. JS divergence is used for numerical features and L-infinity distance is used for categorical features. When this distance score exceeds a user configurable threshold, it is indicative of skew between the training and production feature values.

Setup monitoring by running one simple command
Our goal is to make it very easy to turn on monitoring for a model deployed on Vertex AI’s Prediction service; almost as easy as just flipping a switch. Once a prediction endpoint is up and running, one can turn on training-serving skew detection by running a single gcloud command (and soon via a few clicks in the UI); no need for any pre-processing or extra setup tasks.
To setup skew detection for a prediction endpoint, simply run a gcloud command such as:
gcloud beta ai model-monitoring-jobs create--project=example--region=us-central1--display-name=my_monitoring_job--emails=example1@foobar.com,example2@foobar.com--endpoint=<endpoint_id>--prediction-sampling-rate=0.2--feature-thresholds=feat1=0.1,feat2=0.2,feat3=0.05,feat4=0.5--dataset=<dataset_id>--target-field=price
Let’s look at some of the key parameters (full gcloud docs are available here):
-
emails: The email addresses to which you would like monitoring alerts to be sent
-
endpoint: the prediction endpoint ID to be monitored
-
prediction-sampling-rate: For cost efficiency, it is usually sufficient to monitor a subset of the production inputs to a model. This parameter controls the fraction of the incoming prediction requests that are logged and analyzed for monitoring purposes
-
dataset: For calculating the baseline, you can specify the training dataset via one of four options: a BigQuery table, a CSV file on Cloud Storage, a TFRecord file on Cloud Storage, or a managed dataset on Vertex AI. Please review the gcloud docs for information about the parameters “bigquery-uri”, “dataset”, “data-format” and “gcs-uris”.
-
target-field: This specifies the field or column in the training dataset (also sometimes referred to as the ‘label’), that the model is trained to predict.
-
monitoring-frequency: The time interval at which production (i.e. serving) inputs should be analyzed for skew. This is an optional parameter. It is set to 24 hours by default.
-
feature-thresholds: Specify which input features to monitor, along with the alerting threshold for each feature. The alerting threshold is used to determine when an alert should be thrown. This is an optional parameter. By default, a threshold of 0.3 is used for each feature.
Get alerts and visualize data in the console UI
When a skew is detected for a feature, an alert is sent via email. (More ways of receiving alerts will be added in the near future, including mechanisms to trigger a model retraining pipeline).
Upon getting an alert, users can log into the console UI to visualize and analyze the feature value distributions. Users can perform side by side visualization of the production data distributions and training data distributions, to diagnose the issue.

Next Steps
Now Model Monitoring is available as Preview. Anyone can try it from the Model Monitoring document, and there is also a great instruction demo video and example notebook created by Marc Cohen that provides the end-to-end scenario from deploying a model to an Endpoint to monitor the model with Model Monitoring. Take the first step into the real-world MLOps with Google’s best practices for productionizing ML systems.


