Networking
GCP-networking-01.jpg
Before you migrate workloads to the cloud, you need to benchmark network performance in order to understand how that performance affects your business applications. Unfortunately, the cloud hasn’t offered the standards, tools, and methods to do the benchmark testing you need. As a result, you’re forced to make deployment decisions without comprehensively understanding the implications of network performance for your use case.
Today, we’re excited to make a few announcements that will help you understand cloud network performance more quickly and easily:
-
We are investing in performance benchmarking tools. To begin with, we merged new contributions to PerfKit Benchmarker, an open-source tool created inside Google that makes network performance benchmarking faster and easier by automating network setup, provisioning of VMs, and test runs. With the updates, PerfKit Benchmarker now supports a broader range of network performance tests for VM-to-VM latency, throughput, packets-per-second for multiple clouds (inter-region, inter-zone, intra-zone, and on-prem to cloud), and lets you view the results in Google Data Studio (free to use). With this information, you can more accurately predict the performance impact of moving workloads to/across different clouds.
-
The publication of a new benchmarking methodology for using PerfKit Benchmarker continuously and consistently. This methodology, co-developed with performance engineering researchers at Southern Methodist University’s AT&T Center for Virtualization, is based on Google’s own internal best practices. “Continuous performance measurement and benchmarking are essential for understanding trends and patterns in large-scale cloud deployments,” said Suku Nair, director of SMU AT&T Center for Virtualization. “PerfKit Benchmarker, which wraps over 100 industry standard benchmark testing tools in an easy-to-use and extensible manner, is a key enabler in automating this process.”
Read on for an overview of how to use PerfKit Benchmarker to take advantage of its new features, such as support for additional performance metrics (e.g., packets per second) and deployment use cases (e.g., VPN).
Using PerfKit Benchmarker
PerfKit Benchmarker automates the setup and teardown of all the resources you need to run tests on (or between) most major public cloud providers, as well as on-premises deployments like Docker and OpenStack. Specifically, it automates the setup and provisioning of networks, subnets, firewalls and firewall rules, virtual machines, and drives required to run a large variety of benchmarks, as well as running the benchmarks themselves and tearing down the infrastructure afterwards.
Along with installing and running the actual benchmark tests, PerfKit Benchmarker packages the test results in an easy-to-consume JSON format and offers hooks into backend storage providers like Google BigQuery, Elasticsearch, and InfluxDB to automate publishing results, making reporting and analytics a breeze.
When performing network tests, the critical metrics you need to understand include throughput, latency, jitter, and packets per second. To find the values of these metrics across various configurations, you can use PerfKit Benchmarker to draw upon a number of testing tools, including iperf2, iperf3, ping, netperf, nuttcp, nttcp and NTttcp, just to name a few.
Once PerfKit Benchmarker has been installed, running a single benchmark is simple: Specify the test you want to run and where you want to run it. As a basic example, here is a ping benchmark between two VMs that are located in zone us-east1-b of Google’s cloud:
./pkb.py --benchmarks=ping --zones=us-east1-b --cloud=GCP
This command creates a new Virtual Private Cloud (VPC) and two new VMs in zone us-east1-b of Google Cloud, configures them for a ping test (including setting the appropriate firewall rules), runs the test, and then deletes the VMs and the VPC. Finally, it outputs the results to the console and stores them in a file in the /tmp directory. You can also store results in BigQuery or Elasticsearch when appropriate flags have been set.
Measuring Google Cloud inter-region latency with PerfKit Benchmarker
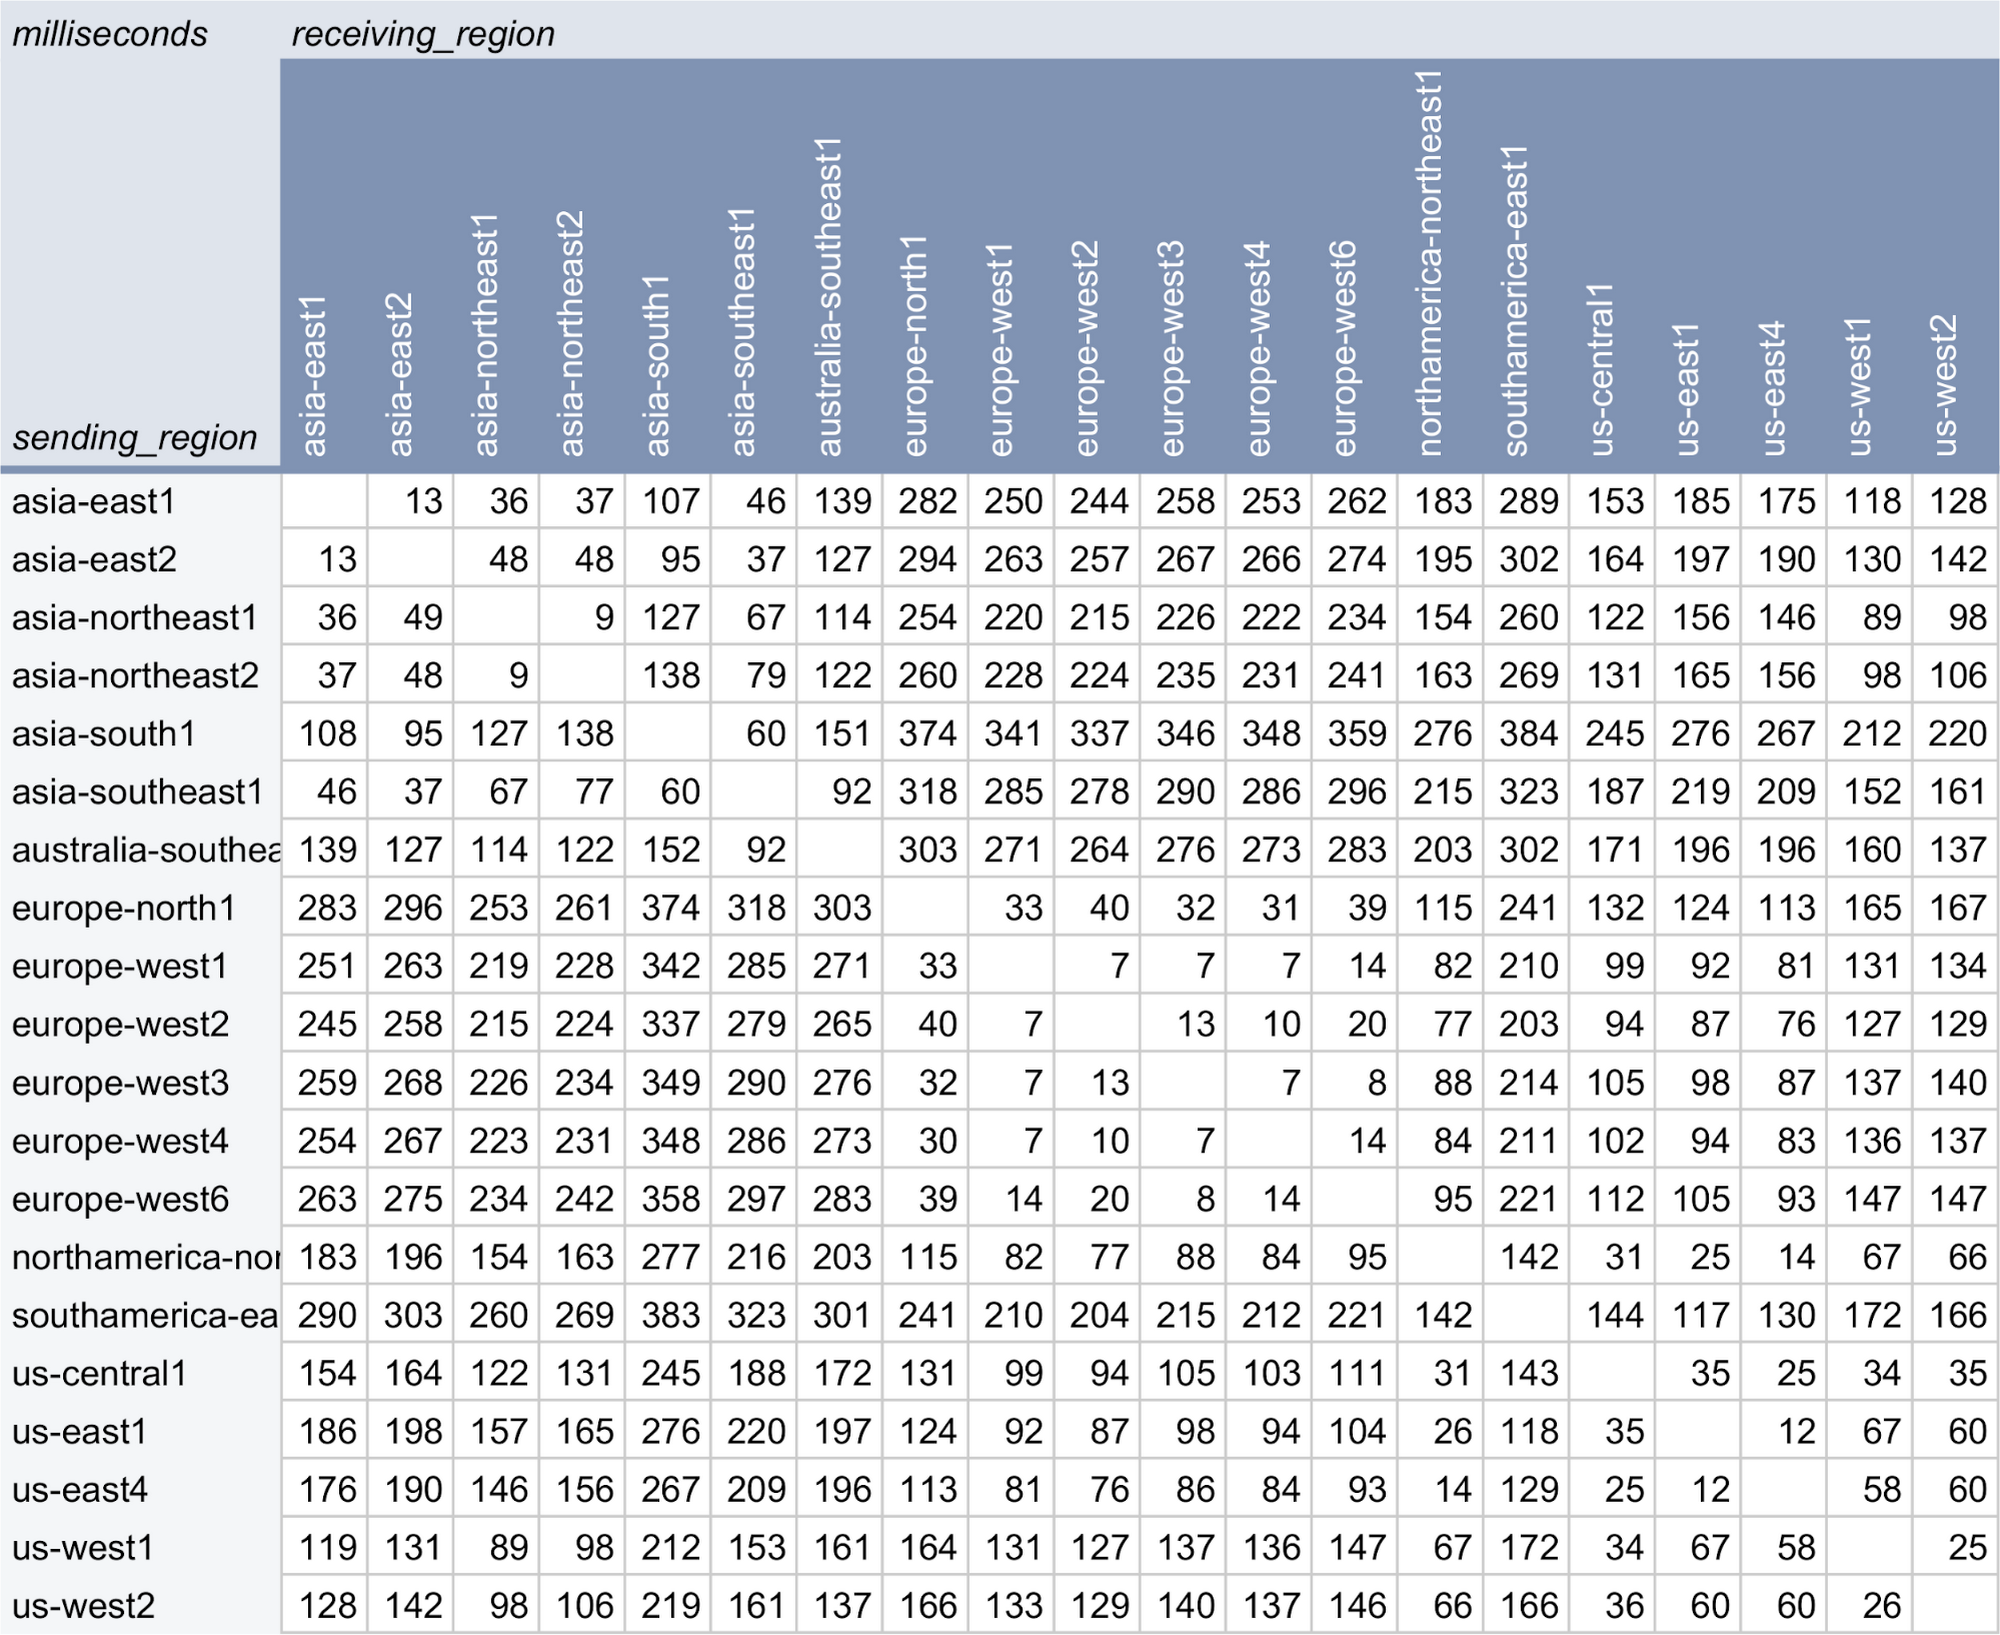
When designing your environment, it’s important to understand the latency between components in different Google Cloud regions. As an example, here are the results of our own all-region to all-region round trip latency tests using n1-standard-2 machine types and internal IP addresses. The daily benchmark tests ran over the course of the last month. The statistics were all collected using PerfKit Benchmarker to run ping benchmarks between VMs in each pair of regions.

To reproduce this chart, you can run the following command with the following config file. To run a smaller subset of regions, just remove the regions you don’t want included from the zones and extra_zones lists.
ping:flag_matrix: inter_regionflag_matrix_filters:inter_region: "zones < extra_zones"flag_matrix_defs:inter_region:zones: [asia-east1-a,asia-east2-a,asia-northeast1-a,asia-northeast2-a,asia-south1-a,asia-southeast1-a,australia-southeast1-a,europe-north1-a,europe-west1-c,europe-west2-a,europe-west3-a,europe-west4-a,europe-west6-a,northamerica-northeast1-a,southamerica-east1-a,us-central1-a,us-east1-b,us-east4-a,us-west1-a,us-west2-a]extra_zones: [asia-east1-a,asia-east2-a,asia-northeast1-a,asia-northeast2-a,asia-south1-a,asia-southeast1-a,australia-southeast1-a,europe-north1-a,europe-west1-c,europe-west2-a,europe-west3-a,europe-west4-a,europe-west6-a,northamerica-northeast1-a,southamerica-east1-a,us-central1-a,us-east1-b,us-east4-a,us-west1-a,us-west2-a]flags:cloud: GCPgce_network_tier: premiummachine_type: n1-standard-2ping_also_run_using_external_ip: True
You can also add the --run_processes=<# of processes> flag to tell it to run multiple benchmarks in parallel. Furthermore, you can add the --gce_network_name=<network name> flag to have each benchmark use a Cloud VPC you have already created so each benchmark doesn’t make its own VPC.
./pkb.py --benchmarks=ping --benchmark_config_file=/pat /to/all_region_latency.yaml
More benchmarks using PerfKit Benchmarker
Other examples of network performance benchmark tests you can run using PerfKit Benchmarker include:
-
Inter-region, inter-zone, and intra-zone network performance tests
-
On-premises to cloud and cross-cloud performance benchmarks between a VM in one cloud, and a VM on-premises or in another cloud
-
Performance benchmarks using various network tiers
-
Benchmarking across various guest OSes (e.g., Linux vs Windows) and machine types (e.g., general purpose, compute-optimized)
For complete details about the methodology for running more of these benchmarks, read the “Measuring cloud network performance with PerfKit Benchmarker” methodology white paper.
More good stuff on the way
By using PerfKit Benchmarker, you can make better decisions about where to put workloads, and improve the experience of your end-users. As time goes on, we’ll continue to add coverage for new performance benchmarking use cases, publish additional guidelines for cloud performance benchmarking, and report on the experiences of cloud adopters. In the meantime, we welcome and encourage new contributions to the PerfKit Benchmarker codebase, and look forward to seeing the community grow!


