New KB articles published for the week ending 20th April,2019
April 22, 2019
21 CyberSecurity Twitter Accounts You Should Be Following
April 22, 2019Monitoring provides a time series list API method, which returns collected time series data. Using this API, you can download your monitoring data for external storage and analysis. For example, using the Monitoring API, you could download your time series and then store it in BigQuery for efficient analysis.
Analyzing metrics over a larger time window means that you’ll have to make a design choice around data volumes. Either you include each individual data point and incur the time and cost processing of each one, or you aggregate metrics over a time period, which reduces the time and cost of processing at the expense of reduced metrics granularity.
Monitoring provides a powerful aggregation capability in the form of aligners and reducers available in the Monitoring API. Using aligners and reducers, you can collapse time-series data to a single point or set of points for an alignment period. Selecting an appropriate alignment period depends on the specific use case. One hour provides a good trade-off between granularity and aggregation.
Each of the Monitoring metrics have a metricKind and a valueType, which describe both the type of the metric values as well as what the values represent (i.e., DELTA or GAUGE values). These values determine which aligners and reducers may be used during metric aggregation.
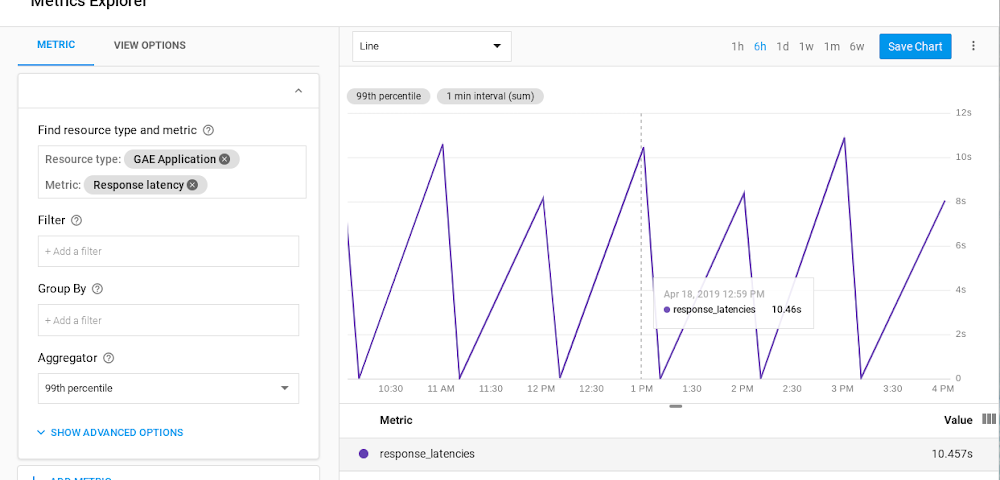
For example, using an ALIGN_SUM aligner, you can collapse your App Engine http/server/response_latencies metrics for each app in a given Stackdriver Workspace into a single latency metric per app per alignment period. If you don’t need to separate the metrics by their associated apps, you can use an ALIGN_SUM aligner combined with a REDUCE_PERCENTILE_99 reducer to collapse all of your App Engine latency metrics into a single value per alignment period, as shown here:


